Introduction to Collaborator Visualization and Conflict Prevention
In today’s fast-paced and interconnected business environment, collaboration is essential for success. However, with diverse teams working together, conflicts can arise due to differences in personalities, working styles, and goals. Visualizing collaborator relationships and potential conflicts can help organizations proactively prevent and manage these issues, leading to more harmonious and productive work environments.
The Importance of Collaborator Visualization
Collaborator visualization is the process of mapping out the relationships and interactions between team members, departments, and external partners. By creating a visual representation of these connections, organizations can:
- Identify key players and influencers
- Understand communication patterns and workflows
- Detect potential bottlenecks or single points of failure
- Recognize opportunities for collaboration and knowledge sharing
The Role of Conflict Prevention in Collaboration
Conflict prevention is a proactive approach to managing potential disputes before they escalate into full-blown conflicts. By identifying and addressing the root causes of conflicts early on, organizations can:
- Foster a more positive and productive work environment
- Reduce the time and resources spent on conflict resolution
- Improve team morale and employee retention
- Enhance decision-making and problem-solving capabilities
Techniques for Collaborator Visualization
There are several techniques organizations can use to visualize collaborator relationships and interactions. Some of the most effective methods include:
Social Network Analysis (SNA)
SNA is a technique that uses graph theory to map out the relationships between individuals or groups. By representing collaborators as nodes and their interactions as edges, SNA can help organizations:
- Identify central figures and key influencers
- Detect subgroups or cliques within the network
- Understand the flow of information and resources
- Identify potential bottlenecks or single points of failure
| Advantage | Disadvantage |
|---|---|
| Provides a comprehensive view of the network | Can be time-consuming and data-intensive |
| Helps identify hidden patterns and relationships | Requires specialized software and expertise |
| Can be used to simulate different scenarios | May not capture the nuances of individual relationships |
Organizational Chart Mapping
Organizational chart mapping involves creating a visual representation of the formal reporting structure within an organization. By overlaying collaborator relationships onto the organizational chart, organizations can:
- Identify cross-functional collaborations and dependencies
- Detect potential conflicts due to competing priorities or resource constraints
- Understand the impact of organizational changes on collaborator relationships
| Advantage | Disadvantage |
|---|---|
| Provides a clear overview of the formal structure | May not capture informal relationships and interactions |
| Helps identify potential conflicts due to reporting lines | Can become outdated quickly in dynamic organizations |
| Can be easily created using existing HR data | May not reflect the actual flow of information and decision-making |
Process Flow Mapping
Process flow mapping involves creating a visual representation of the steps and activities involved in a particular process or project. By mapping out the collaborator roles and responsibilities at each stage, organizations can:
- Identify potential bottlenecks or delays due to collaborator availability or expertise
- Detect potential conflicts due to overlapping or unclear roles and responsibilities
- Optimize the process by reallocating resources or redesigning the workflow
| Advantage | Disadvantage |
|---|---|
| Provides a detailed view of the process and collaborator involvement | Can be time-consuming and require input from multiple stakeholders |
| Helps identify potential inefficiencies and improvement opportunities | May not capture the informal interactions and workarounds used in practice |
| Can be used to simulate different scenarios and test process changes | Requires regular updating to reflect changes in the process or collaborator roles |

Strategies for Conflict Prevention in Collaboration
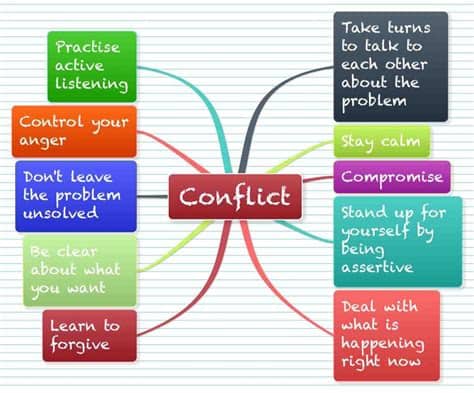
While collaborator visualization can help identify potential conflicts, organizations also need to have strategies in place to prevent and manage these issues. Some effective conflict prevention strategies include:
Clear Roles and Responsibilities
One of the most common causes of conflicts in collaboration is unclear or overlapping roles and responsibilities. To prevent this, organizations should:
- Define clear job descriptions and expectations for each collaborator
- Establish a clear decision-making process and authority structure
- Regularly review and update roles and responsibilities as the project or organization evolves
Effective Communication
Poor communication is another common cause of conflicts in collaboration. To prevent this, organizations should:
- Establish regular check-ins and status updates between collaborators
- Encourage open and honest communication, including constructive feedback and dissenting opinions
- Provide training on effective communication skills, such as active listening and nonviolent communication
Conflict Resolution Training
Despite best efforts to prevent conflicts, they may still arise from time to time. To manage these situations effectively, organizations should:
- Provide training on conflict resolution techniques, such as mediation and negotiation
- Establish a clear process for reporting and resolving conflicts, including escalation paths and timelines
- Encourage a culture of collaboration and mutual respect, where conflicts are seen as opportunities for growth and learning

Case Studies
Case Study 1: Acme Corporation
Acme Corporation, a global manufacturing company, was experiencing frequent delays and cost overruns in its product development process. Using process flow mapping, the company identified several bottlenecks and conflicts between the engineering, procurement, and manufacturing departments.
To address these issues, Acme Corporation:
- Redefined the roles and responsibilities of each department, with clear handoff points and quality criteria
- Established a cross-functional product development team, with representatives from each department
- Implemented a stage-gate process, with regular reviews and approvals at each milestone
As a result, Acme Corporation was able to reduce product development cycle times by 25% and improve on-time delivery to customers by 30%.
Case Study 2: Beta Consulting
Beta Consulting, a professional services firm, was experiencing high turnover and low morale among its project teams. Using social network analysis, the company identified several key influencers who were contributing to a negative work environment and spreading rumors and gossip.
To address these issues, Beta Consulting:
- Provided leadership training and coaching to the key influencers, focusing on positive communication and conflict resolution skills
- Established a peer mentoring program, pairing experienced consultants with new hires to provide guidance and support
- Implemented a 360-degree feedback process, allowing team members to provide anonymous feedback on their colleagues’ performance and behavior
As a result, Beta Consulting was able to reduce turnover by 20% and improve employee engagement scores by 15%.

Frequently Asked Questions (FAQ)
1. What is collaborator visualization?
Collaborator visualization is the process of mapping out the relationships and interactions between team members, departments, and external partners. It helps organizations understand the communication patterns, workflows, and potential bottlenecks in their collaboration network.
2. Why is conflict prevention important in collaboration?
Conflict prevention is important in collaboration because it helps organizations proactively manage potential disputes before they escalate into full-blown conflicts. By identifying and addressing the root causes of conflicts early on, organizations can foster a more positive and productive work environment, reduce the time and resources spent on conflict resolution, and improve team morale and decision-making capabilities.
3. What are some techniques for collaborator visualization?
Some common techniques for collaborator visualization include social network analysis (SNA), organizational chart mapping, and process flow mapping. SNA uses graph theory to map out the relationships between individuals or groups, organizational chart mapping creates a visual representation of the formal reporting structure, and process flow mapping visualizes the steps and activities involved in a particular process or project.
4. How can organizations prevent conflicts in collaboration?
Organizations can prevent conflicts in collaboration by establishing clear roles and responsibilities, promoting effective communication, and providing conflict resolution training. Defining clear job descriptions and expectations, establishing regular check-ins and status updates, and encouraging open and honest communication can help prevent misunderstandings and conflicts from arising. Providing training on conflict resolution techniques and establishing a clear process for reporting and resolving conflicts can also help manage conflicts when they do occur.
5. What are some benefits of using collaborator visualization and conflict prevention strategies?
Some benefits of using collaborator visualization and conflict prevention strategies include improved team morale and productivity, reduced time and resources spent on conflict resolution, enhanced decision-making and problem-solving capabilities, and increased employee retention. By fostering a more positive and collaborative work environment, organizations can unlock the full potential of their teams and achieve better business outcomes.
Conclusion
Collaborator visualization and conflict prevention are essential strategies for organizations looking to foster more productive and harmonious work environments. By mapping out the relationships and interactions between team members, identifying potential conflicts early on, and implementing effective prevention and resolution strategies, organizations can unlock the full potential of their collaborative networks.
While collaborator visualization and conflict prevention require time, effort, and resources to implement effectively, the benefits far outweigh the costs. By investing in these strategies, organizations can improve team morale, reduce turnover, enhance decision-making and problem-solving capabilities, and ultimately achieve better business outcomes.
As the business world becomes increasingly complex and interconnected, the ability to effectively collaborate and manage conflicts will become even more critical for success. Organizations that prioritize collaborator visualization and conflict prevention will be well-positioned to navigate these challenges and thrive in the years ahead.

No responses yet